

EIA Oil Production Scrutiny in 2025: Key Drivers and Data Sources
Figures from the U.S. Energy Information Administration (EIA) for July 2025 showed unexpected production increases in some states, such as Texas and New Mexico, even as rig counts and completion crews declined sharply. These results have fueled discussions ranging from mild skepticism to full-on conspiracy theories from dark corners of the internet.
The EIA gathers data through mandatory monthly submissions on Form EIA-914 from the top 375 oil producers, capturing more than 85% of state-level output. Exemptions apply to operators producing below 500 barrels per day, prioritizing major contributors for comprehensive insights. Weighted least-squares modeling extrapolates the remaining 10% to 15% of production, a technique validated over decades of use.
The survey-driven framework yields reliable projections, evidenced by sampling errors under 1% in Texas and New Mexico based on 2018 evaluations. Events like the late-2000s Haynesville expansion led to brief inaccuracies, yet the approach has matured and now closely aligns with actual production in almost all cases. However, sample-based estimates carry limitations, including inadvertent producer reporting flaws, challenges in dynamic areas, and normal sampling error. Cross-referencing with state filings is advisable, as those sources, though detailed, face delays and early underestimations.
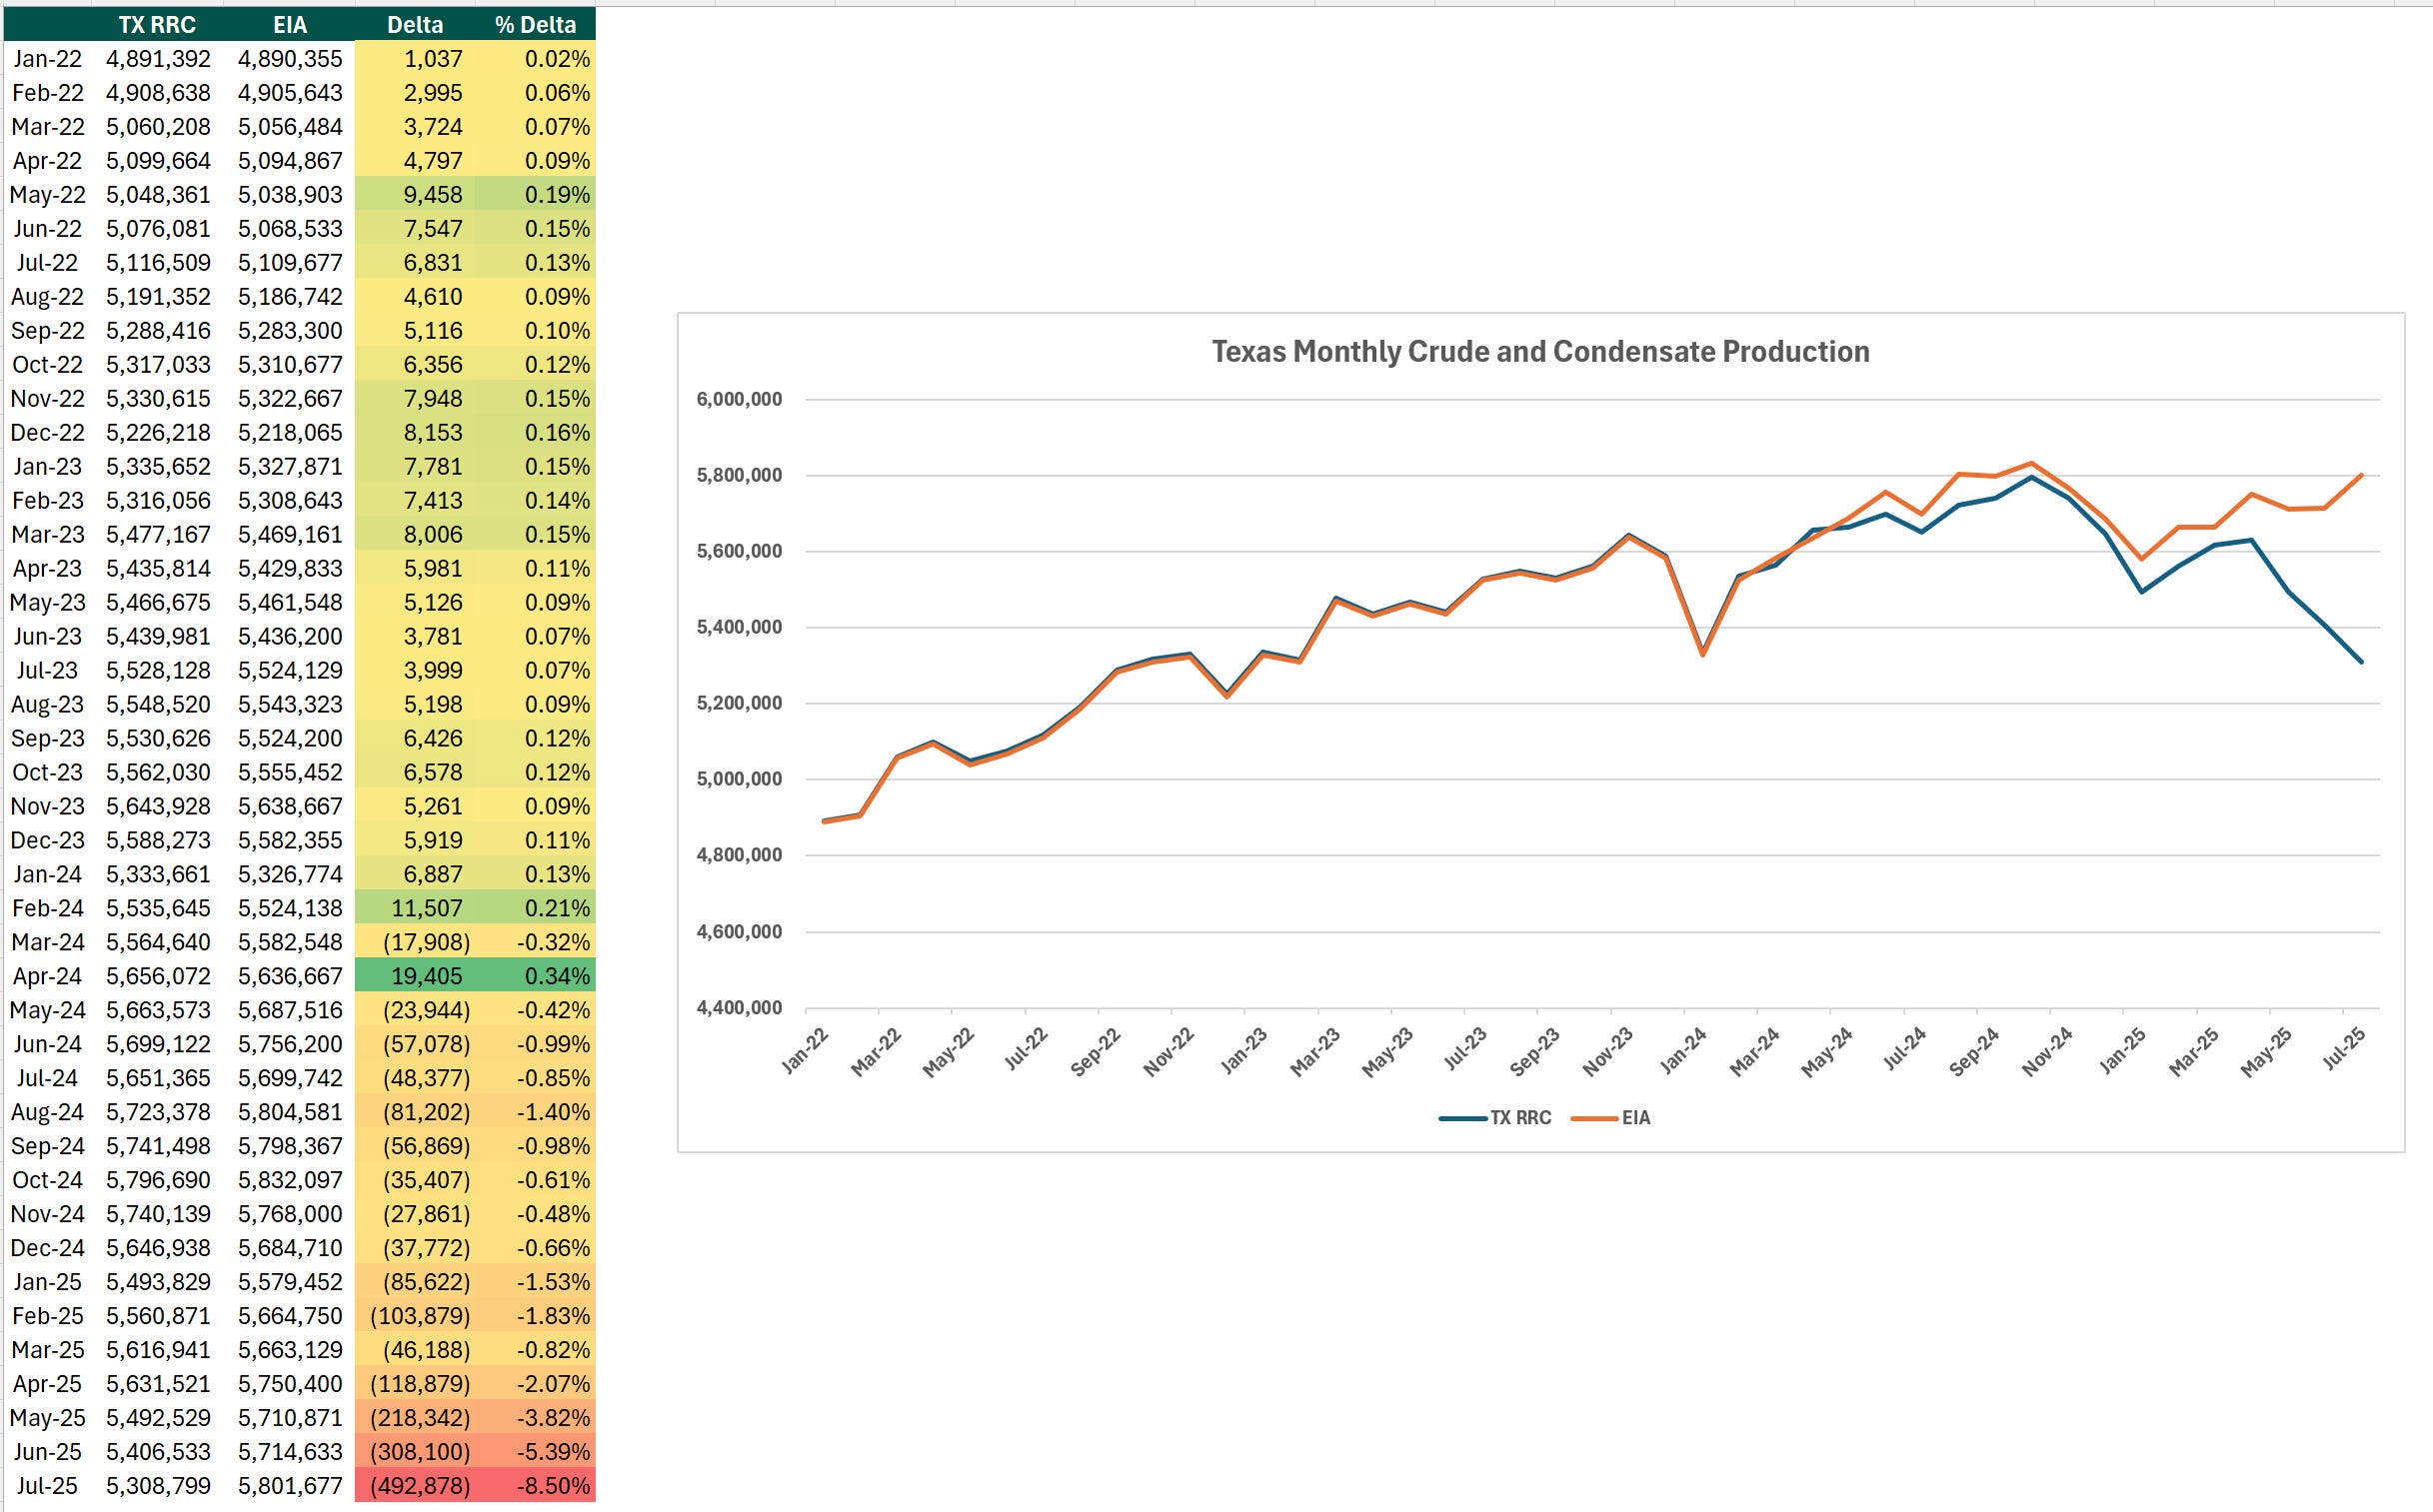
State Level Insights: Texas and New Mexico Reporting Lags and Gaps
Texas mandates monthly production reports from all producers by the end of the subsequent month, but the regulator notes that there are revisions spanning 6 to 8 months due to delayed reporting, resulting in lower reported production versus actual. For April through July 2025, Texas reported production currently lags EIA estimates by 2 to 8%, levels in line with historical reporting.
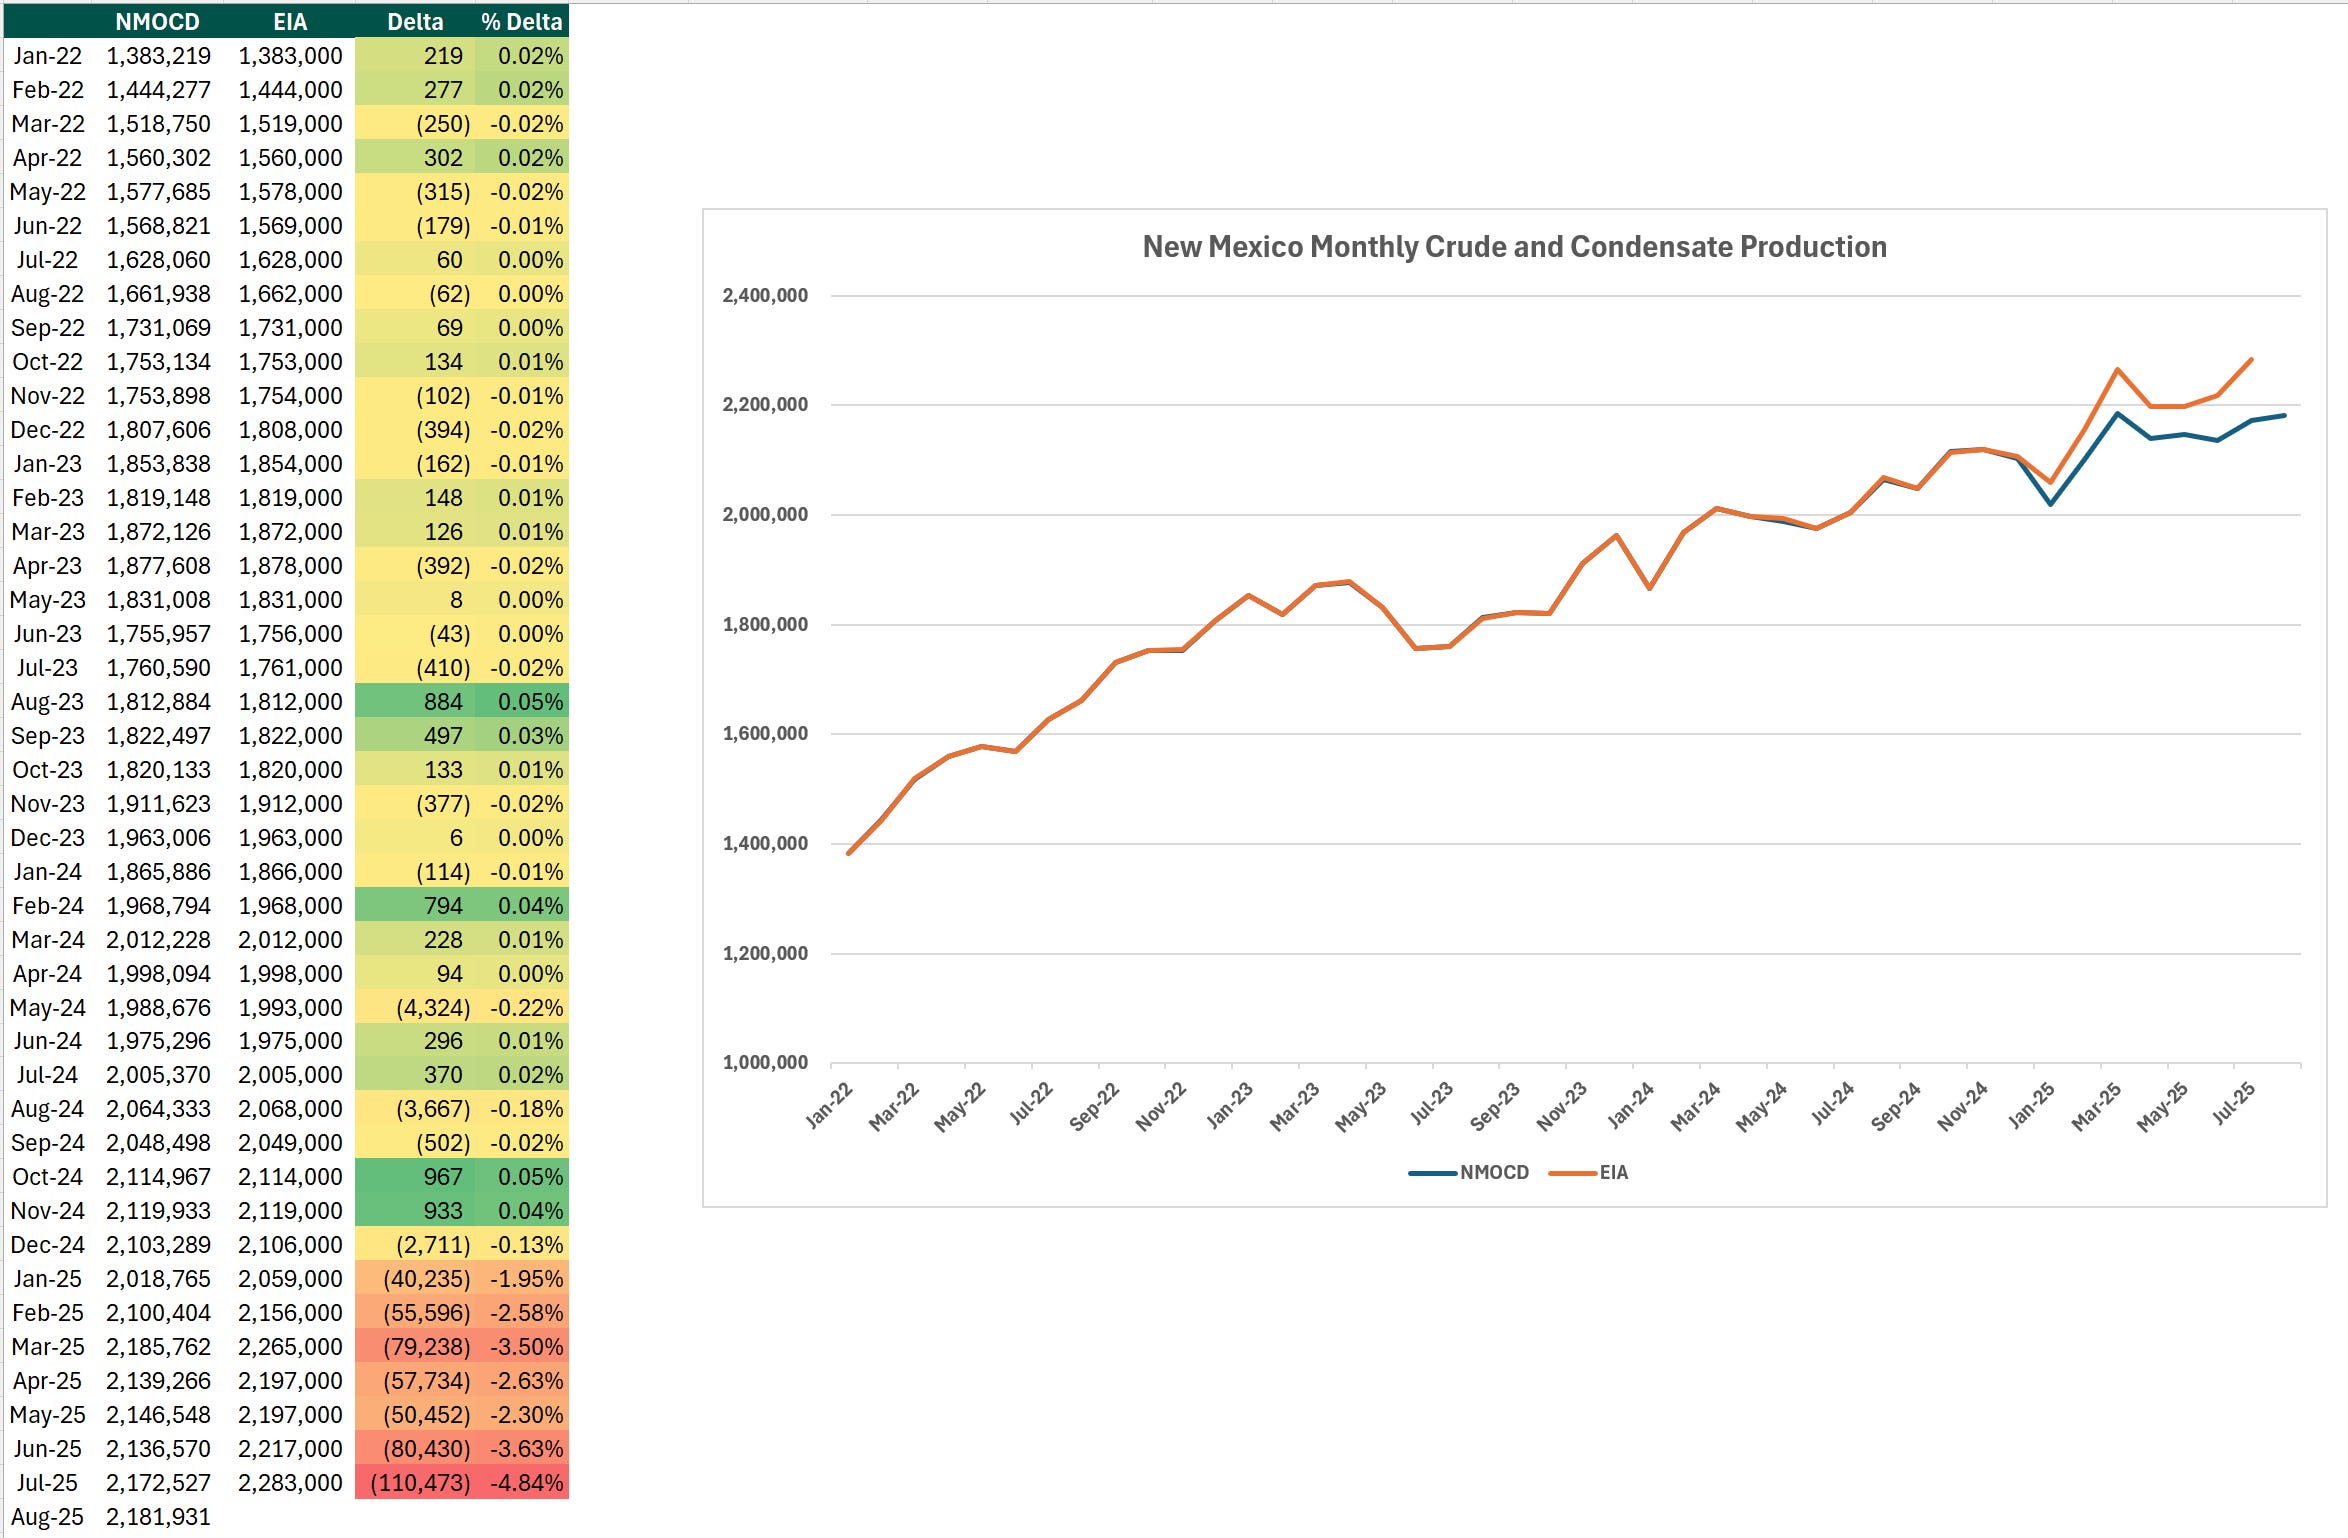
New Mexico’s C-115 submissions exhibit comparable delays, with 2025 variances of 2–5% below EIA reporting. The delta between EIA and New Mexico state reported production exceeds both 2023 and 2024 observed differences but aligns closely with 2022, indicating the delta is not unprecedented.
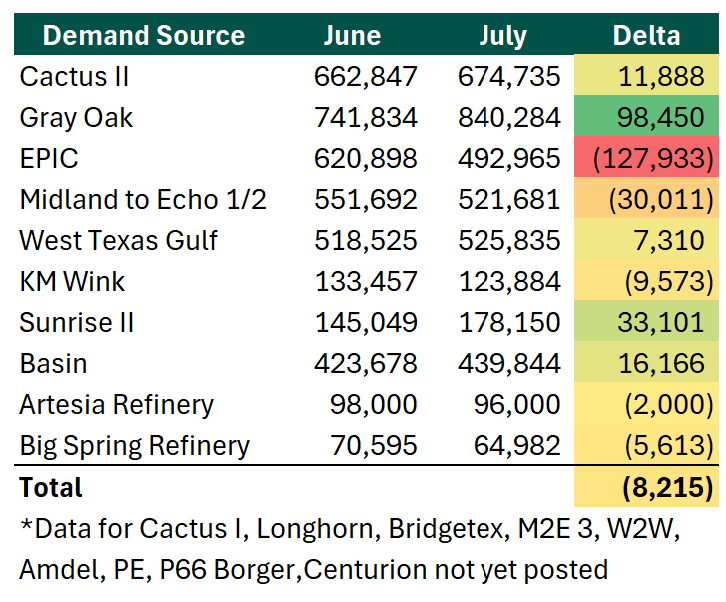
Demand Validation Through Permian Pipelines and Refineries
Data from the demand side of the equation can also provide insights into the validity of reported production growth. Texas requires transporters, storers, and refiners to file forms detailing oil movements and refinery inputs. June through July 2025 records for available pipelines and refineries reveal stable, but not growing, Permian outflows and processing volumes. However, nine prominent pipelines, including vital Permian routes, have not yet reported their June or July data, which might reveal increases bolstering the EIA’s claims of higher production.
U.S. Oil Production Forecast for 2025: Stability at Moderate Prices
Despite falling prices, rig counts, and frac crews, producer and midstream commentary to date has not pointed to material reductions in future production. The midstream entity ONEOK, just this week, projected Permian expansion through 2026, citing conversations with producer customers and recent observed completion activity. Midstream company Enterprise Products followed suit in their earnings call, forecasting growing volumes across their Permian assets through 2026. This narrative aligns with historical patterns, as the U.S. shale industry only materially slows under very steep pricing pressure. Stubbornly high U.S. supply in the face of decreasing prices and increasing production from OPEC+ could have further negative implications for prices going into 2026.

