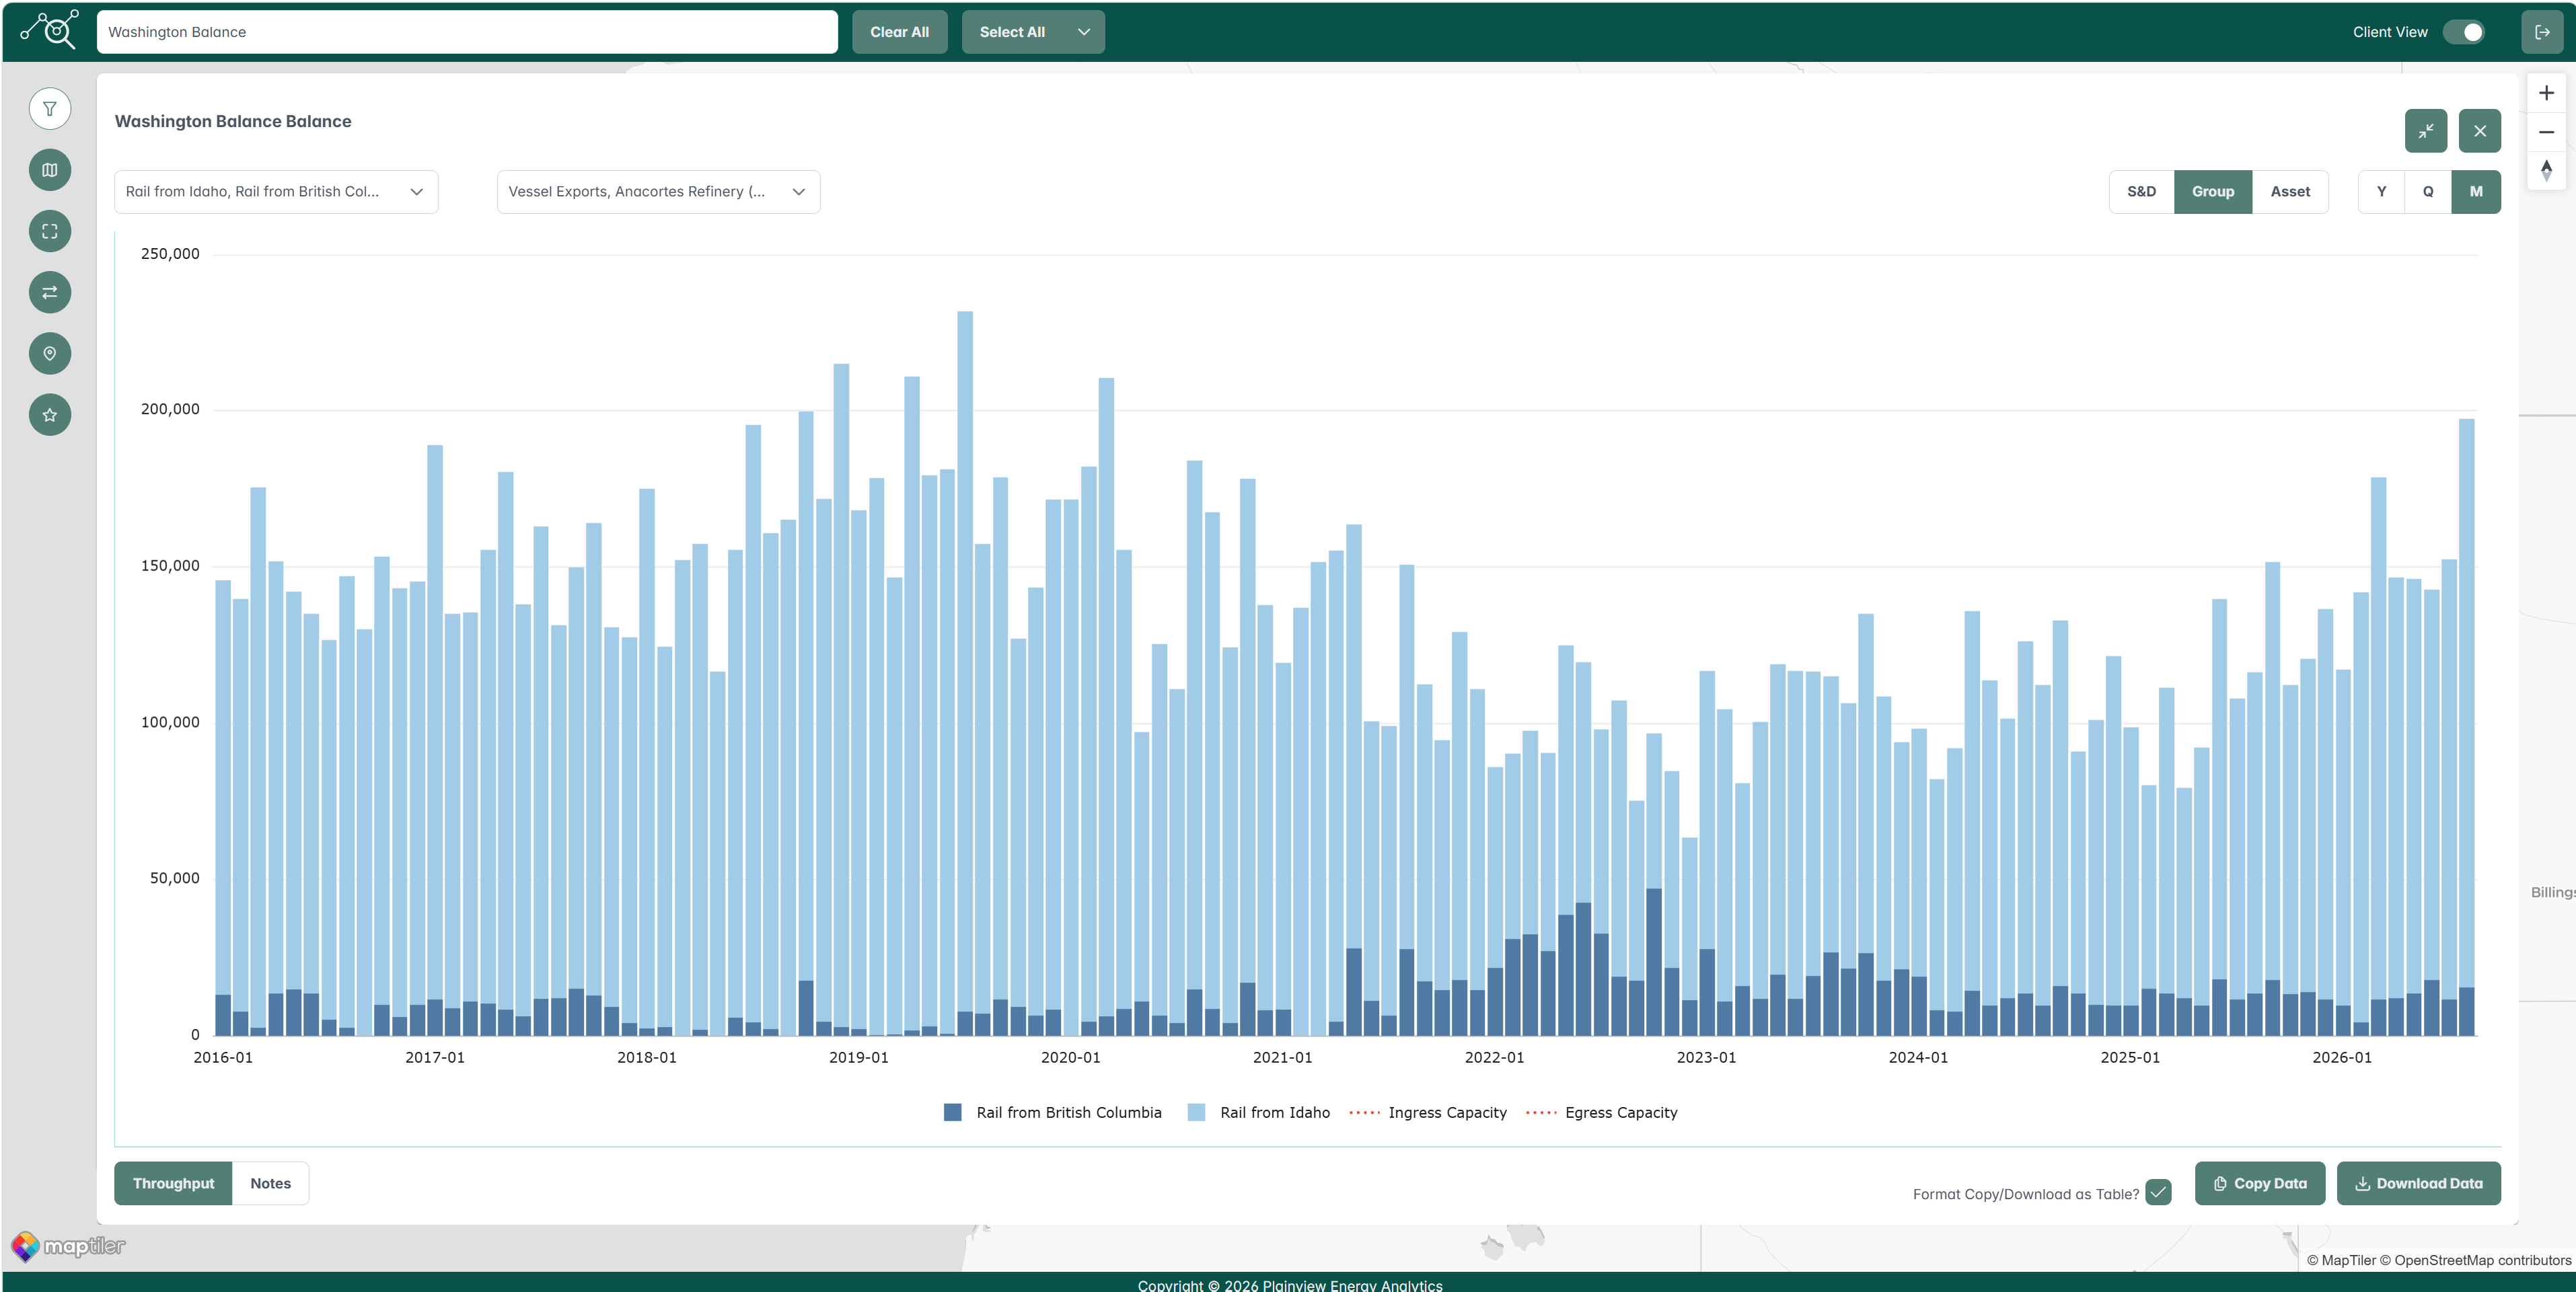
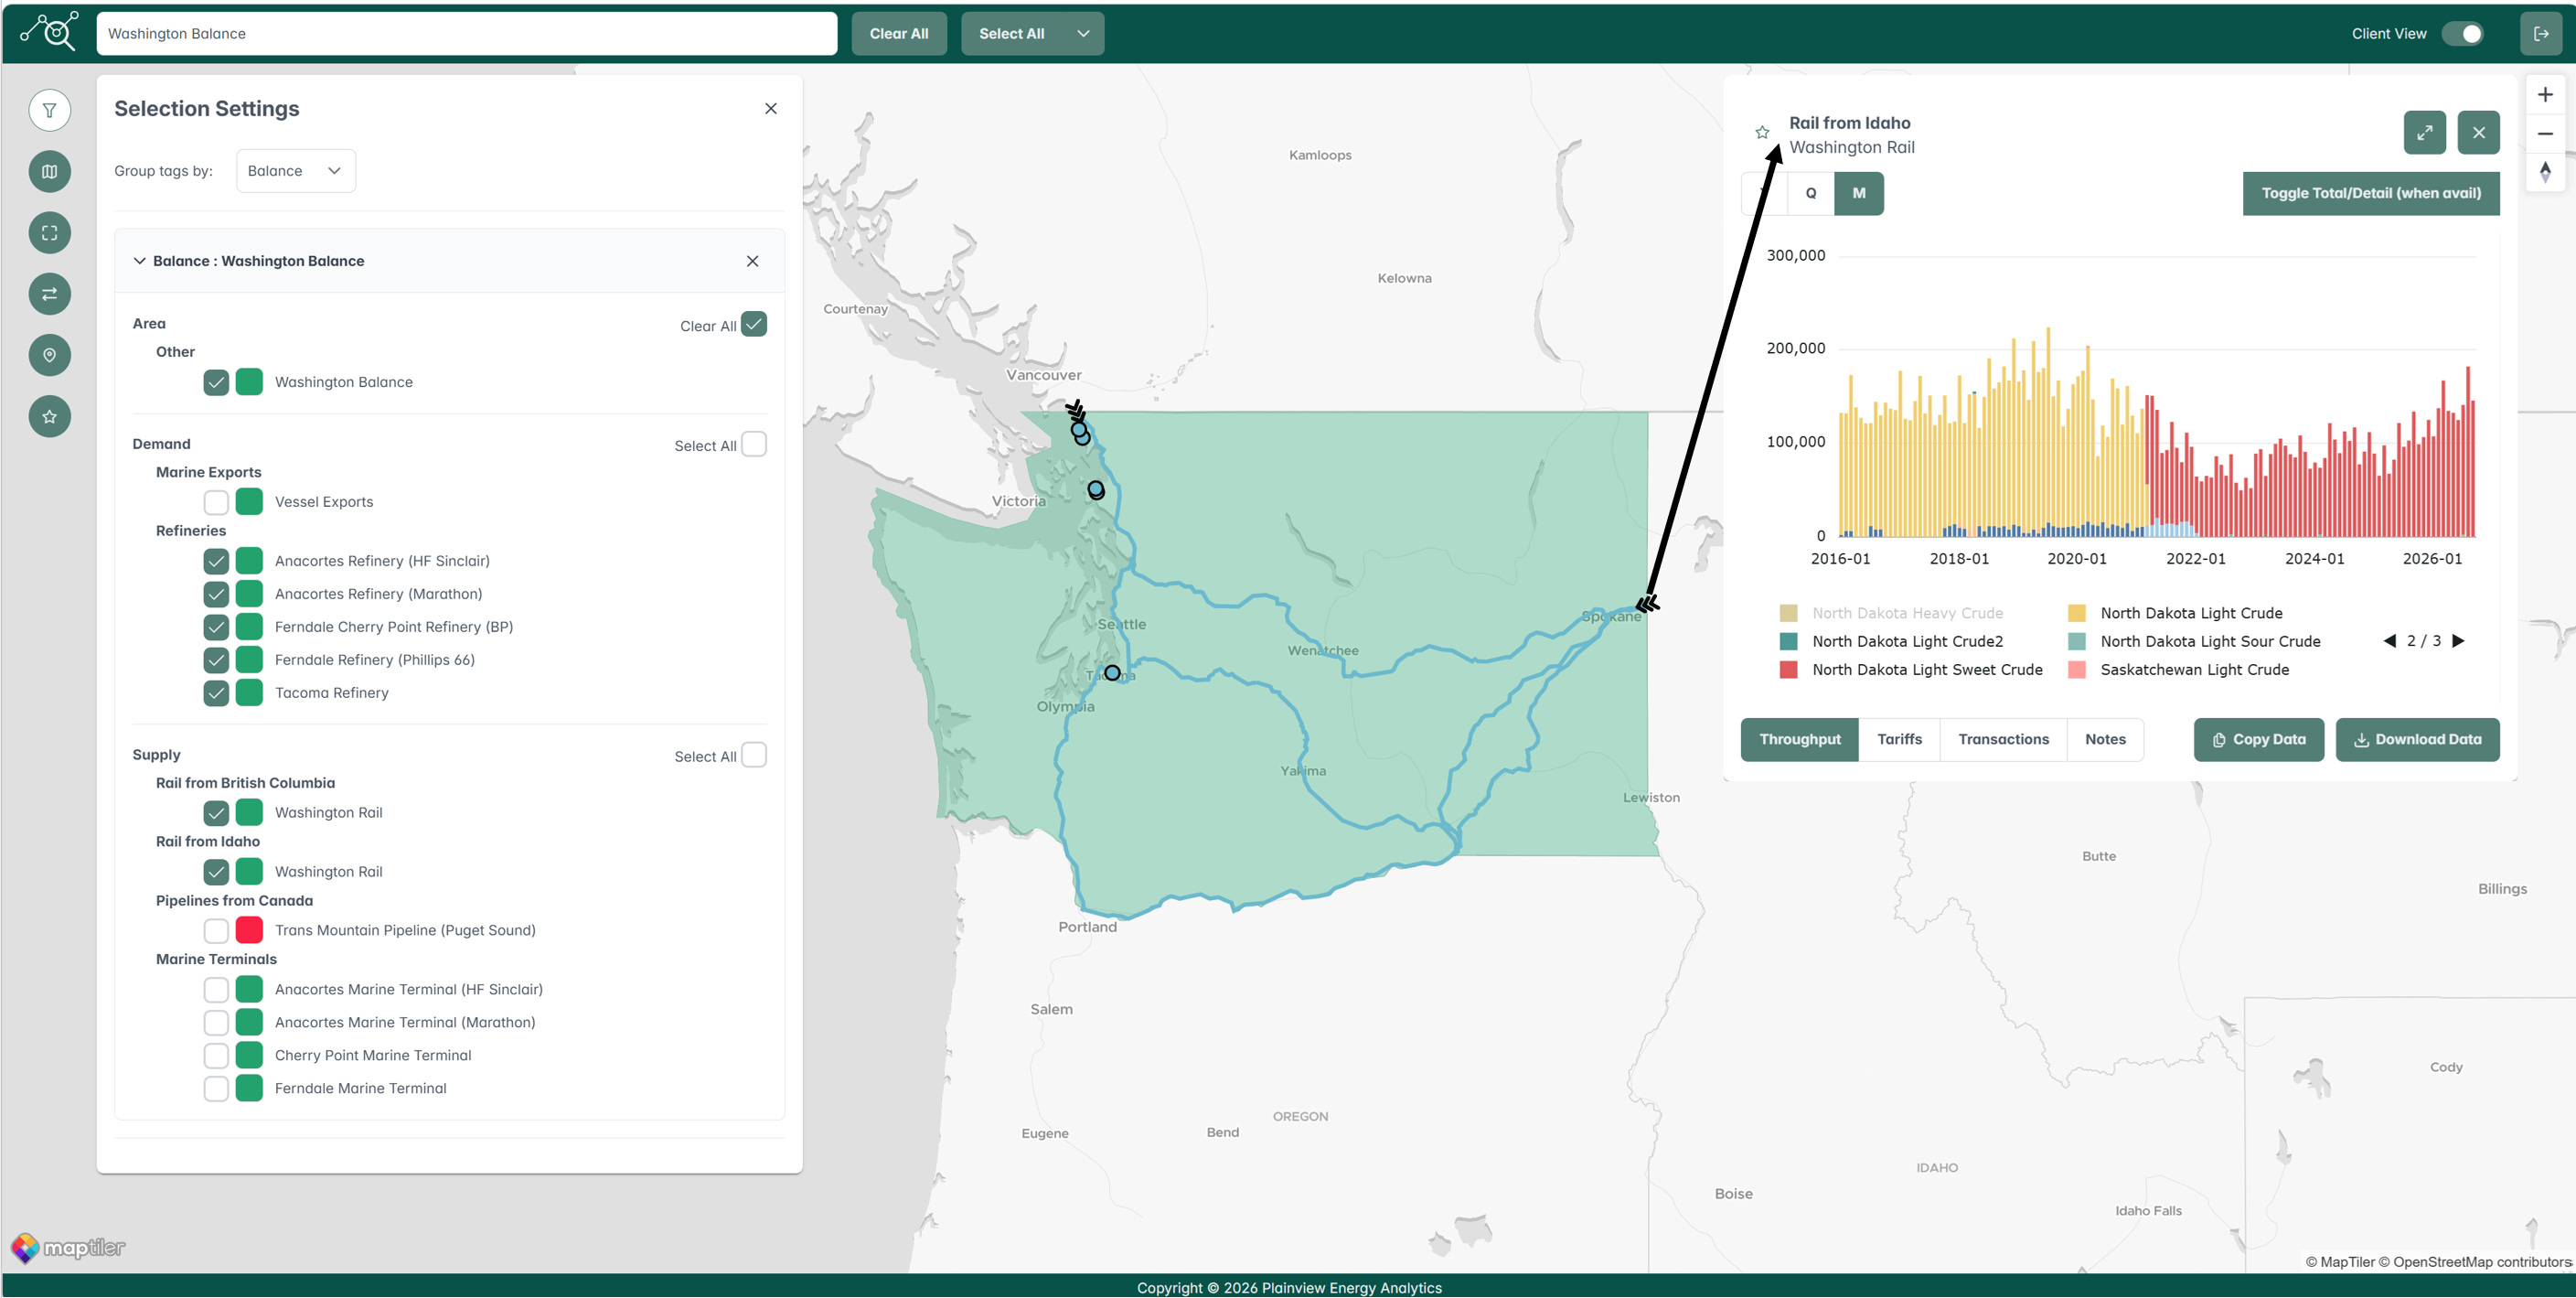
Crude oil arriving in Washington by rail climbed to almost 200,000 barrels per day (bpd) in August, the highest level in 6½ years, according to state data (see graph below). Most of those barrels come from North Dakota’s Bakken, and these shipments to the state are up about 40,000 bpd on average in 2026 compared with 2025. The main reason is likely price. The Iran conflict has made internationally priced marine imports more expensive, so Washington refiners are replacing some waterborne barrels with Bakken crude delivered by rail. That shift has effects well beyond the Pacific Northwest, including for the Bakken pipelines that would otherwise carry those barrels.
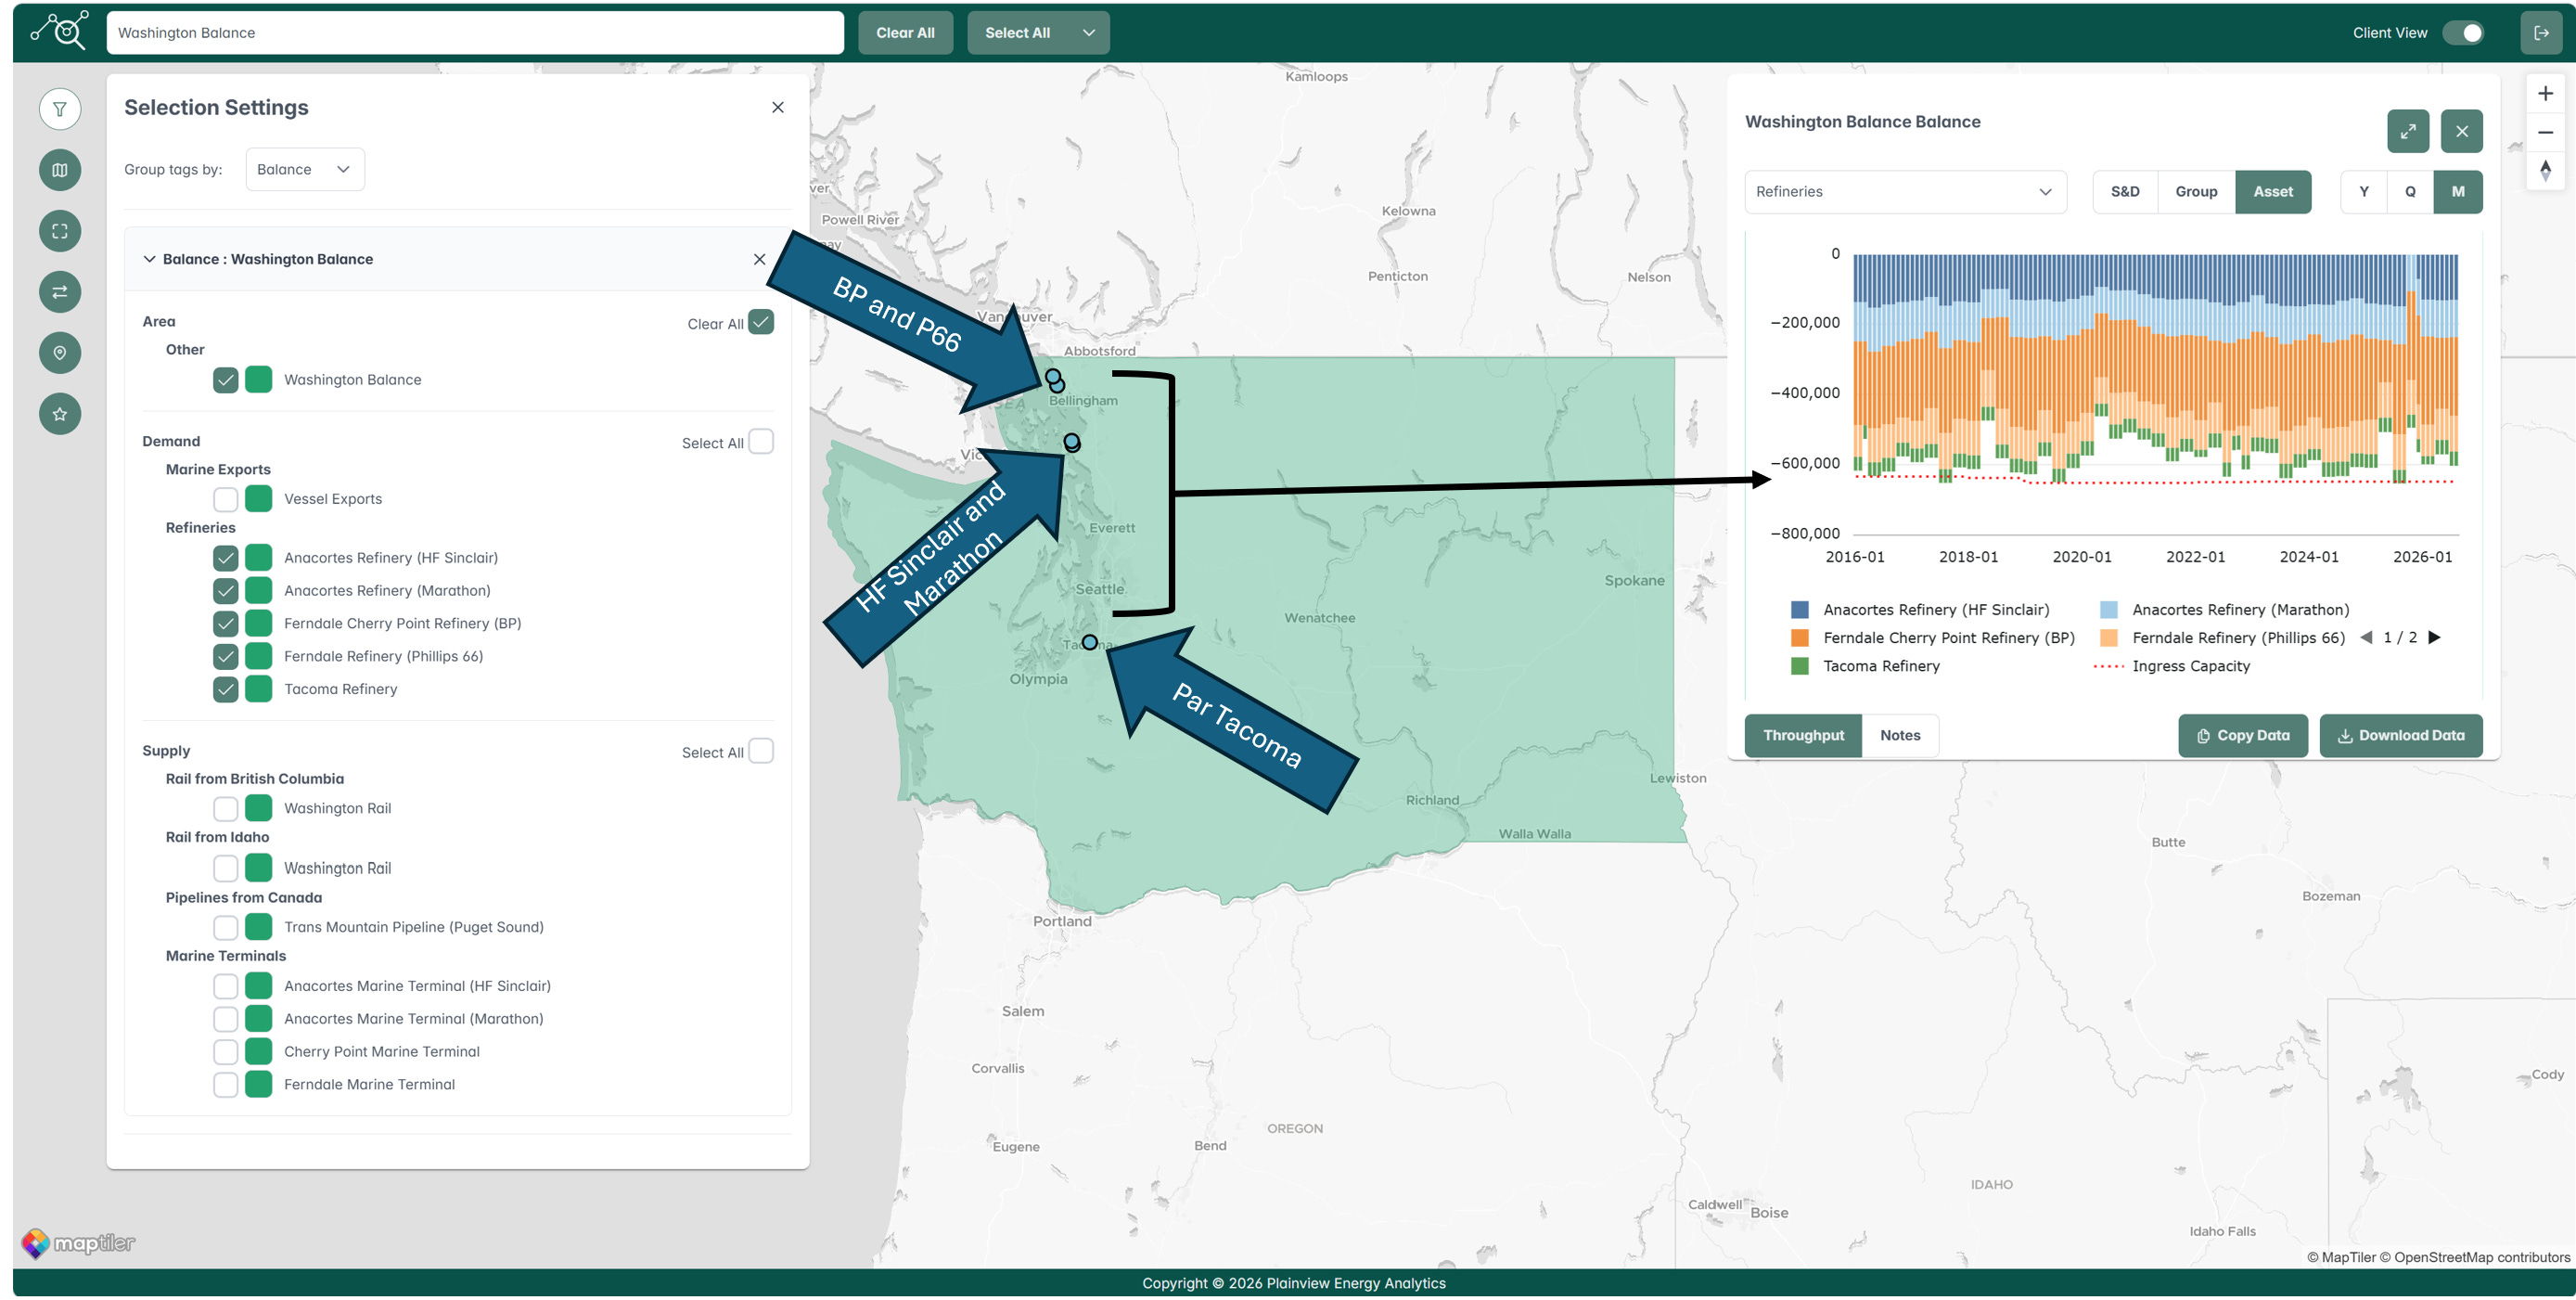
Washington doesn’t come up often when people talk about U.S. crude markets, but its five refineries use about 600,000 bpd of crude. Four of them are in the north near Bellingham, close to the Canadian border: BP’s Cherry Point refinery, Phillips 66’s Ferndale refinery, and the Marathon and HF Sinclair refineries in Anacortes. The fifth is in west-central Washington near Tacoma. Plainview’s interactive crude oil platform shows reported or modeled refinery-level throughputs for each of Washington’s refineries (see map and graph below). These plants get crude from three sources: pipeline, ship and rail.
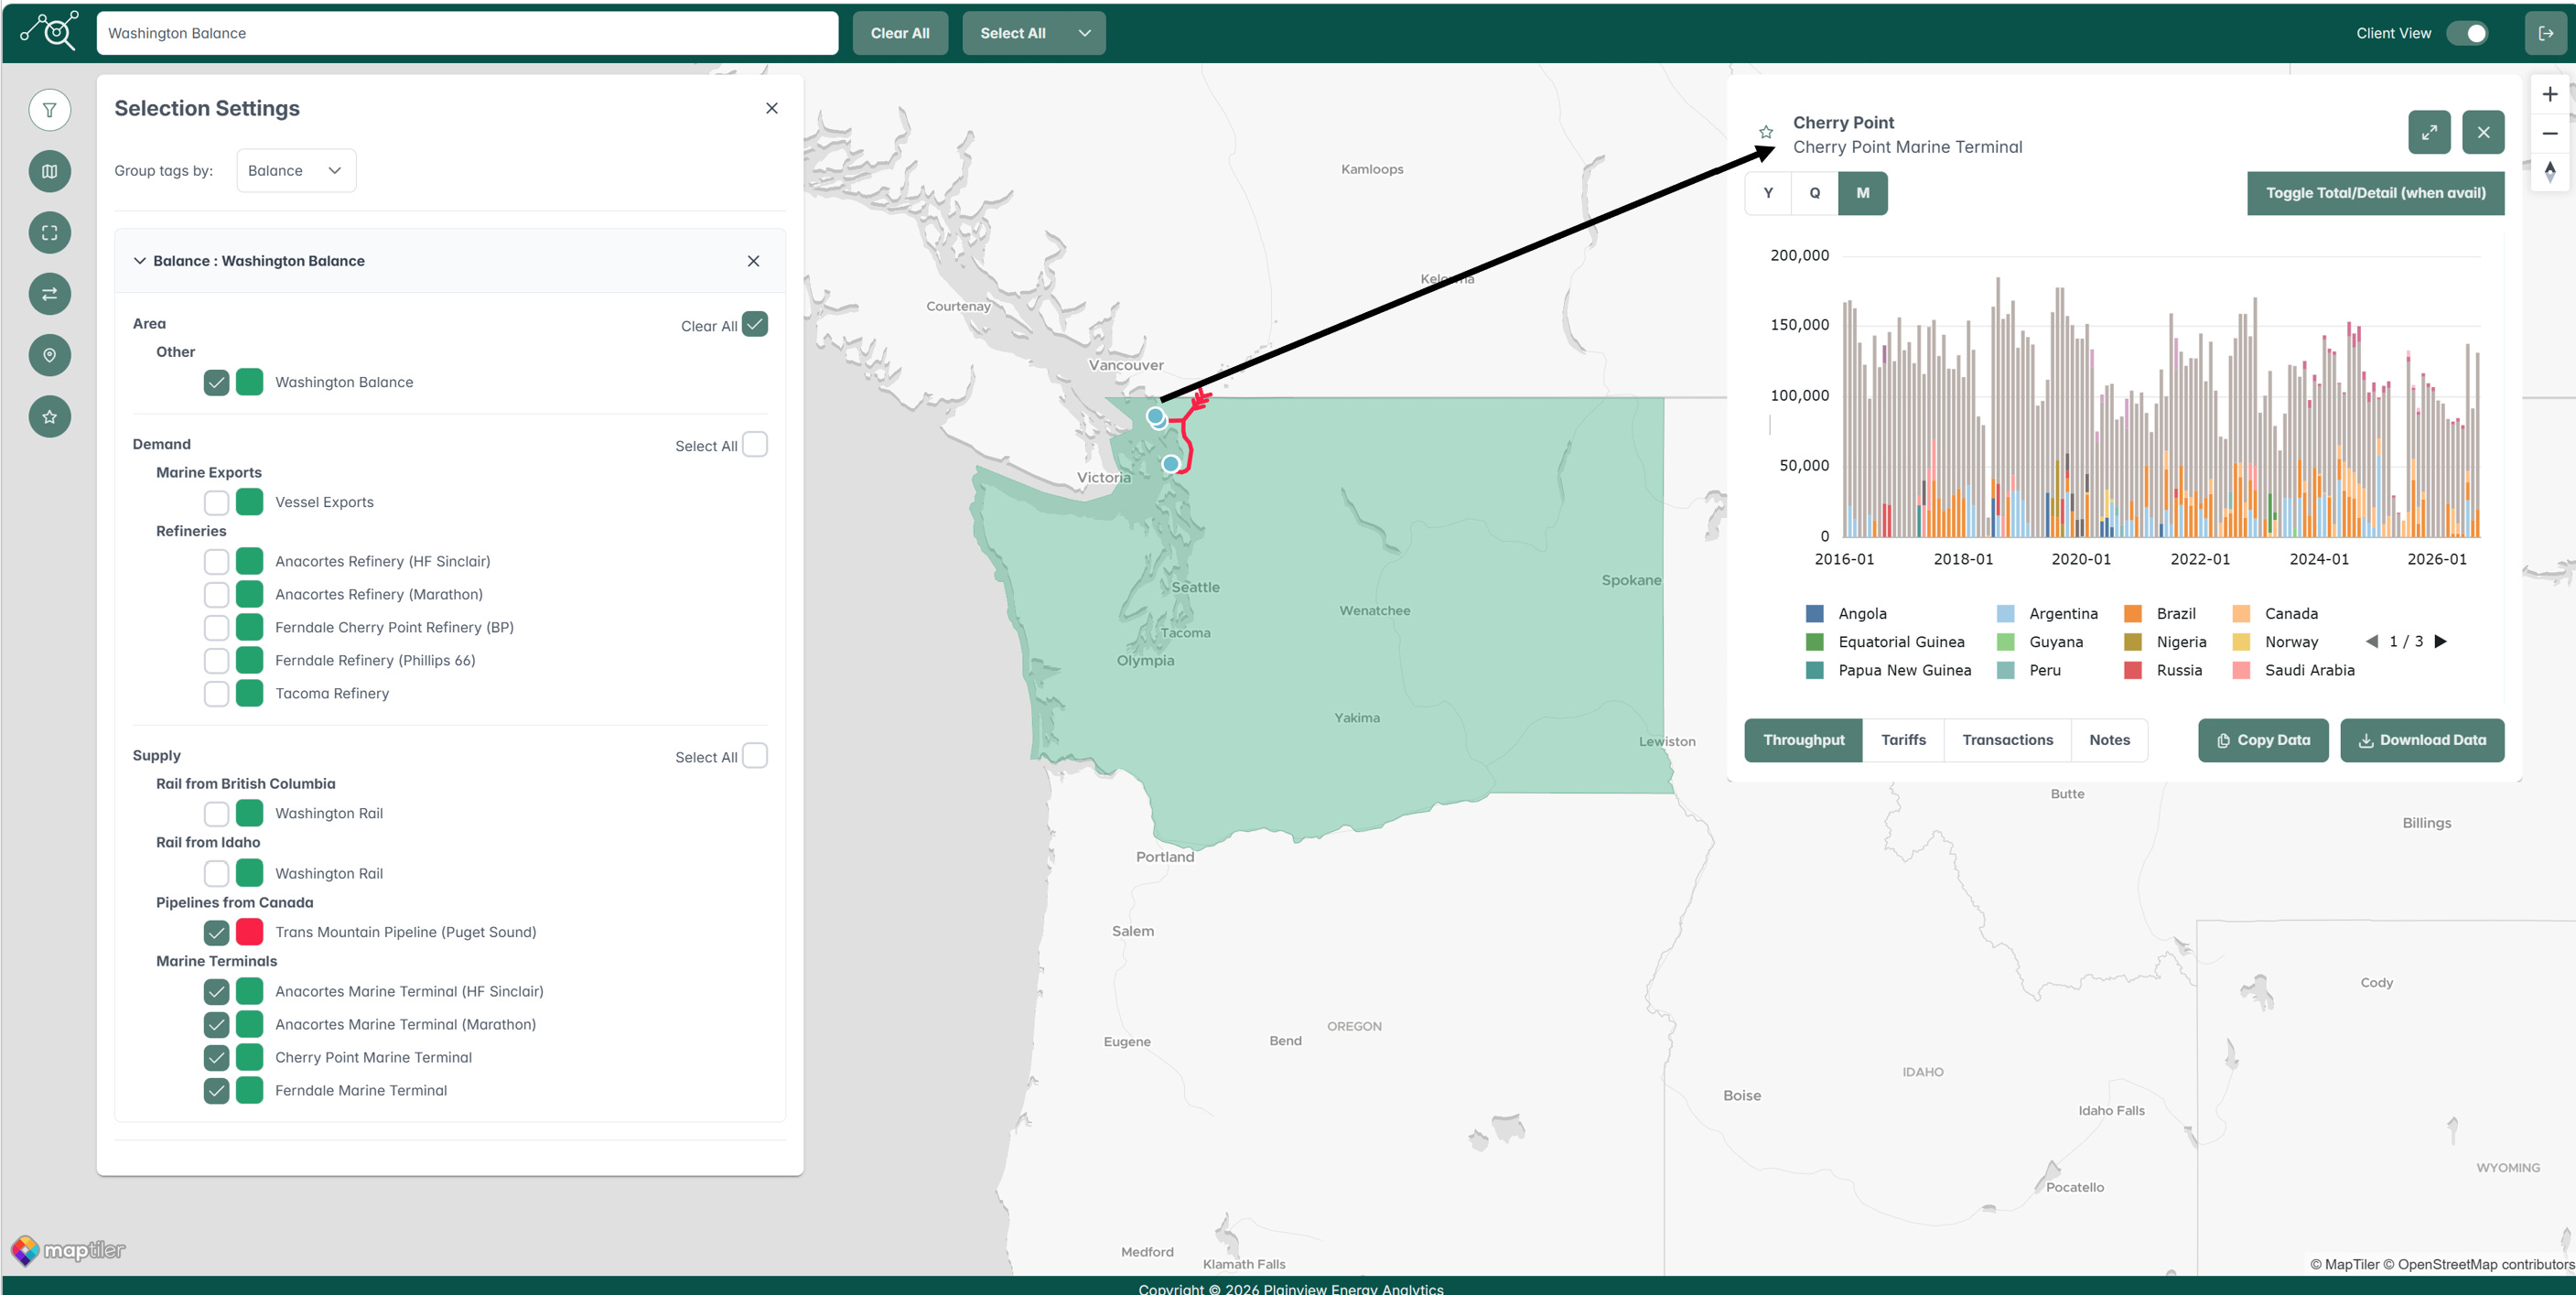
Pipeline imports are the largest source of crude for Washington so far in 2026. Trans Mountain’s Puget Sound lateral (shown in red below) takes about 240,000 bpd off the Trans Mountain mainline, mostly light Canadian crude, and delivers it to the four northern refineries. Marine imports are second, at about 210,000 bpd so far this year, arriving at import terminals at each of those four refineries. Most of the waterborne supply is Alaska North Slope (ANS) crude carried on Jones Act tankers. The rest is a mix of Canadian barrels exported through Trans Mountain’s nearby Westridge Marine Terminal and shipped a short distance south, plus some cargoes from South America. As with our asset-level refinery throughputs, we model throughputs at all four Washington marine terminals. The graph below shows reported and modeled imports by source for BP’s Cherry Point Marine Terminal.
Rail is the third source, and the fastest growing in 2026. The major rail routes are shown as blue lines in the map below. August’s rail volumes were the most since March 2020, before COVID, when they were just over 210,000 bpd. Most rail barrels come from the Bakken and enter on the east side of the state (see graph below). A smaller share enters from the north, near the Bellingham refineries. The added rail volumes are coming mostly at the expense of marine imports, as you would expect when global crude prices rise compared with domestic inland prices.
For midstream investors and operators, this has a marginal but notable impact in North Dakota. An extra 40,000 bpd is not a huge amount on its own, but every barrel that goes west by rail to Washington is a barrel that does not leave the Bakken by pipeline. That volume could otherwise move on systems like Bridger or the Dakota Access Pipeline and earn them tariff revenue. If the gap between international and domestic crude prices stays wide, Washington’s growing reliance on rail could keep pulling Bakken barrels away from pipelines.
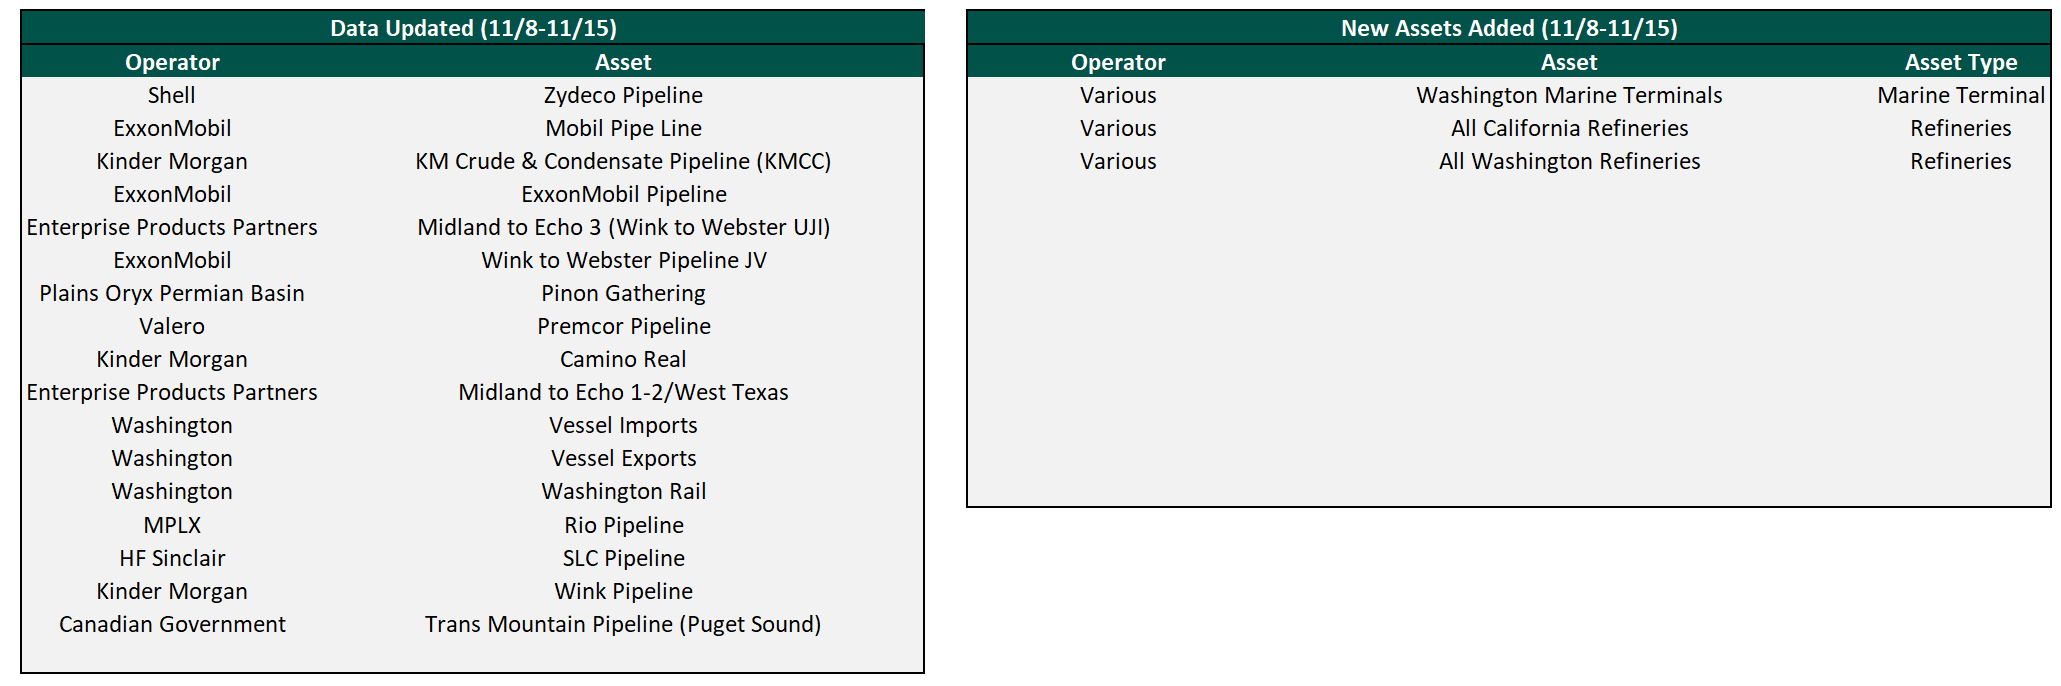
Flow/Transaction Updates and New Assets Under Coverage
Plainview has over 500 assets with crude oil throughput or transactional data on our platform and continues to add more each week. Data for existing assets under coverage are posted as soon as they become available. Below are the assets that were updated this week or newly added to coverage.